
Using Azure IoT Hub and PowerBI to Visualize Plant Floor Data
In my previous post on the Azure IoT Gateway SDK,
we put together a Powershell quick start script for Modbus Gateway projects.
In this post we’ll continue the exploration by connecting a Modbus compatible
Beckhoff BK9100 to Azure IoT Hub, shape our data with Azure Stream Analytics
and then visualizing the current position of a Dynapar optical encoder with
Power Bi.
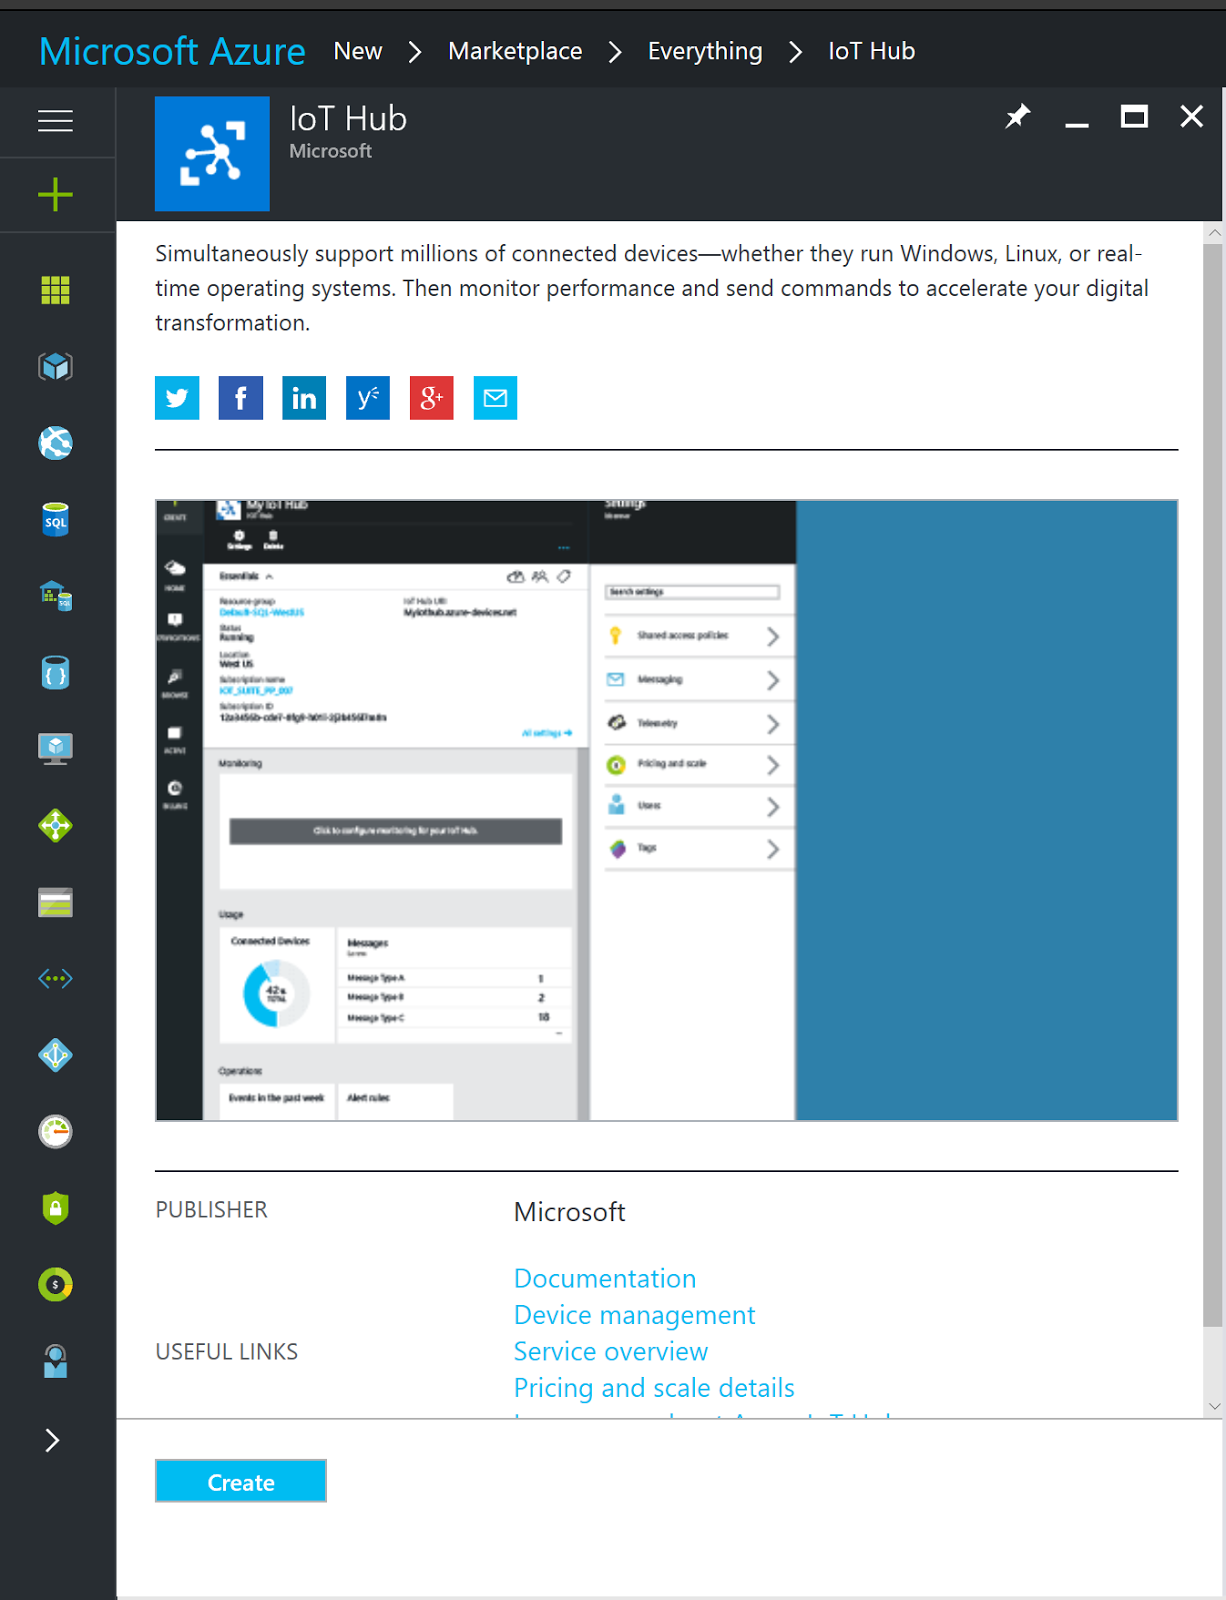
We’ll begin by opening up the Azure Portal, click on the plus icon in the
upper right corner and search for IoT Hub. Once the resource is located,
select Create in the lower left corner.
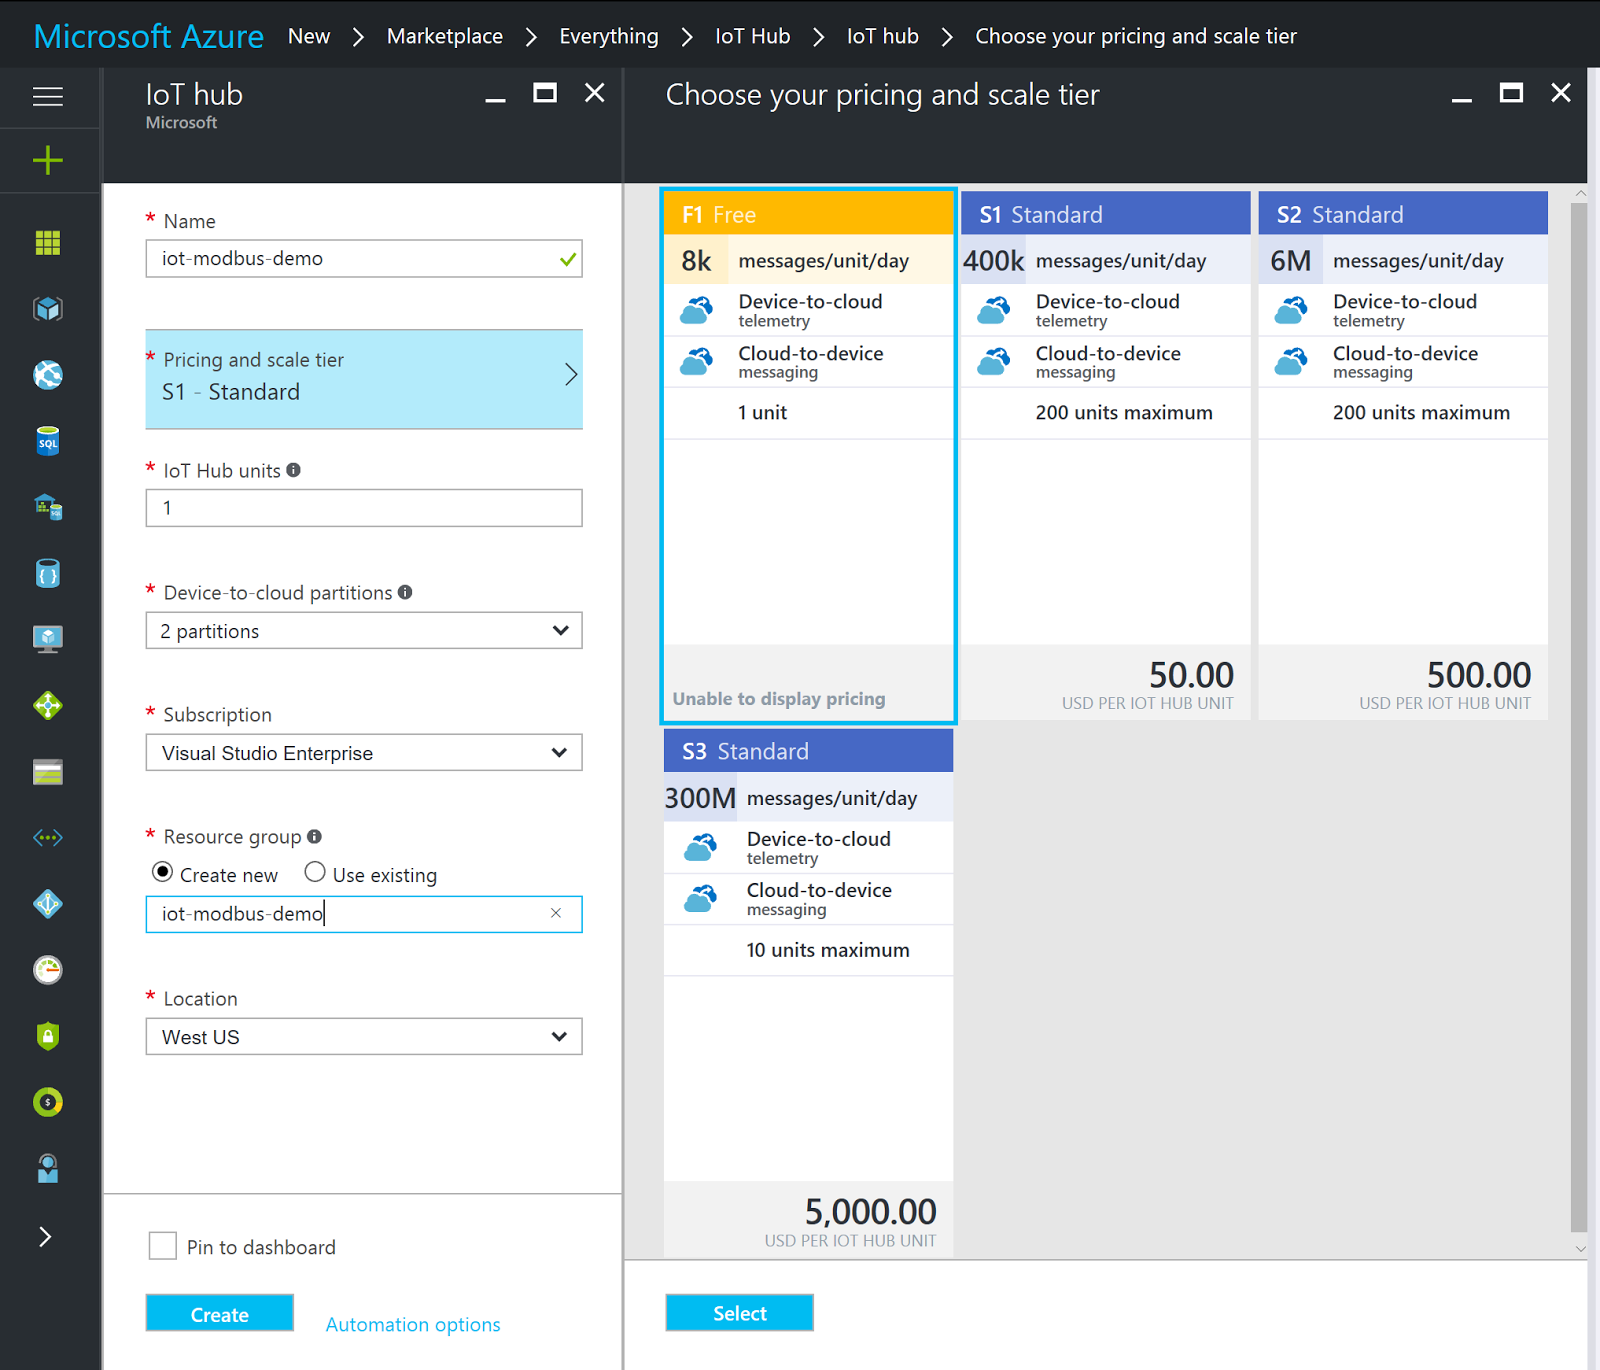
Configure your IoT Hub with a unique name, select an appropriate scale tier, and make sure to put the hub into it’s own resource group for easy clean-up later.
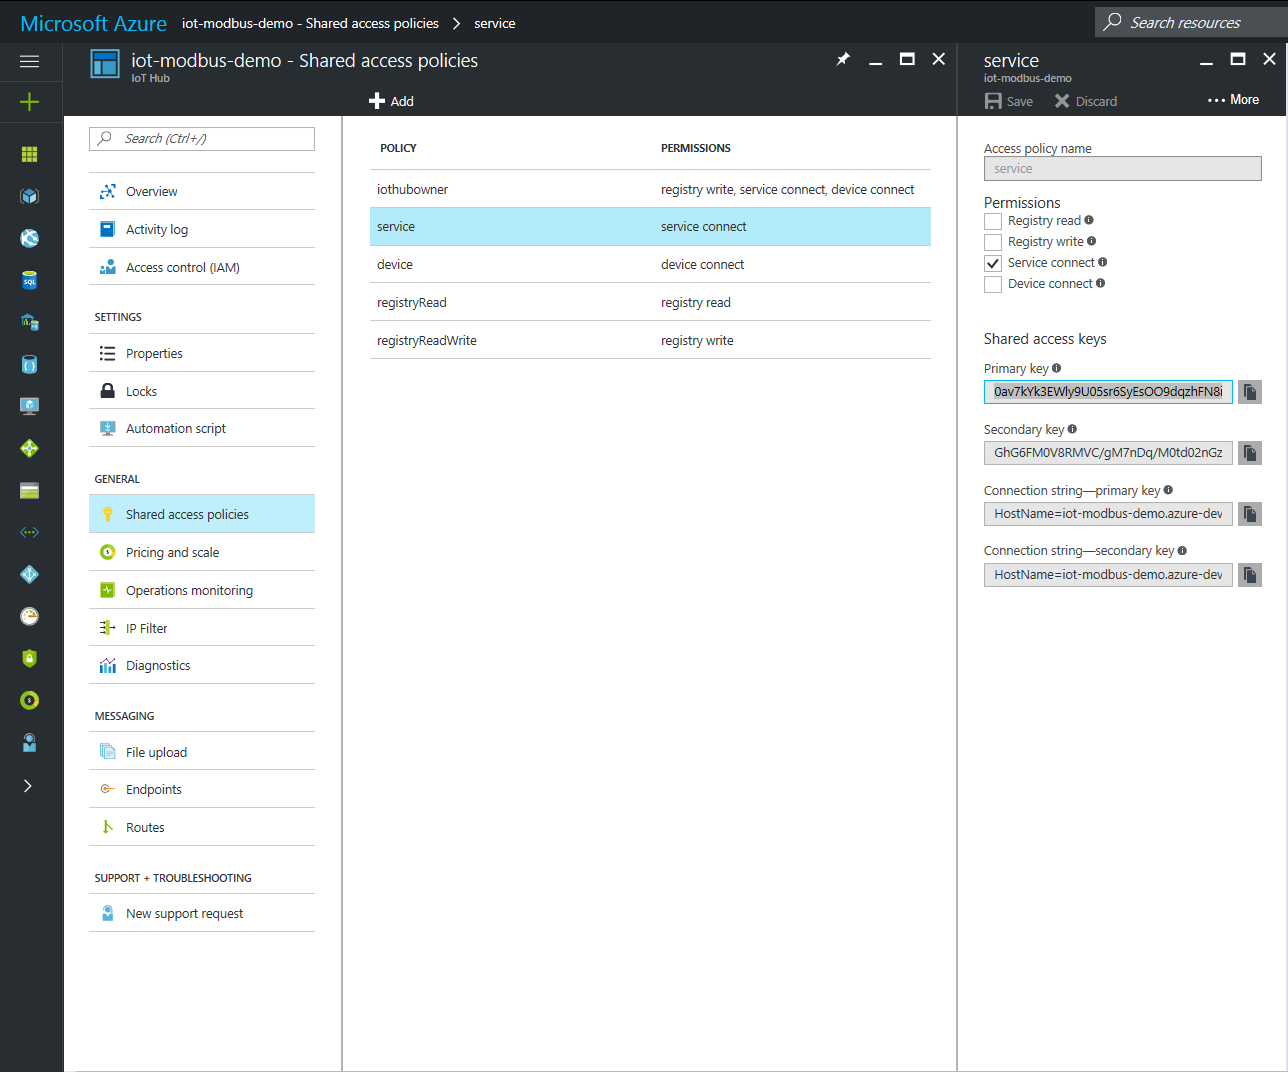
Navigate to the Shared access policies tab of the IoT Hub and paste the
Primary key of the service policy into a text file.
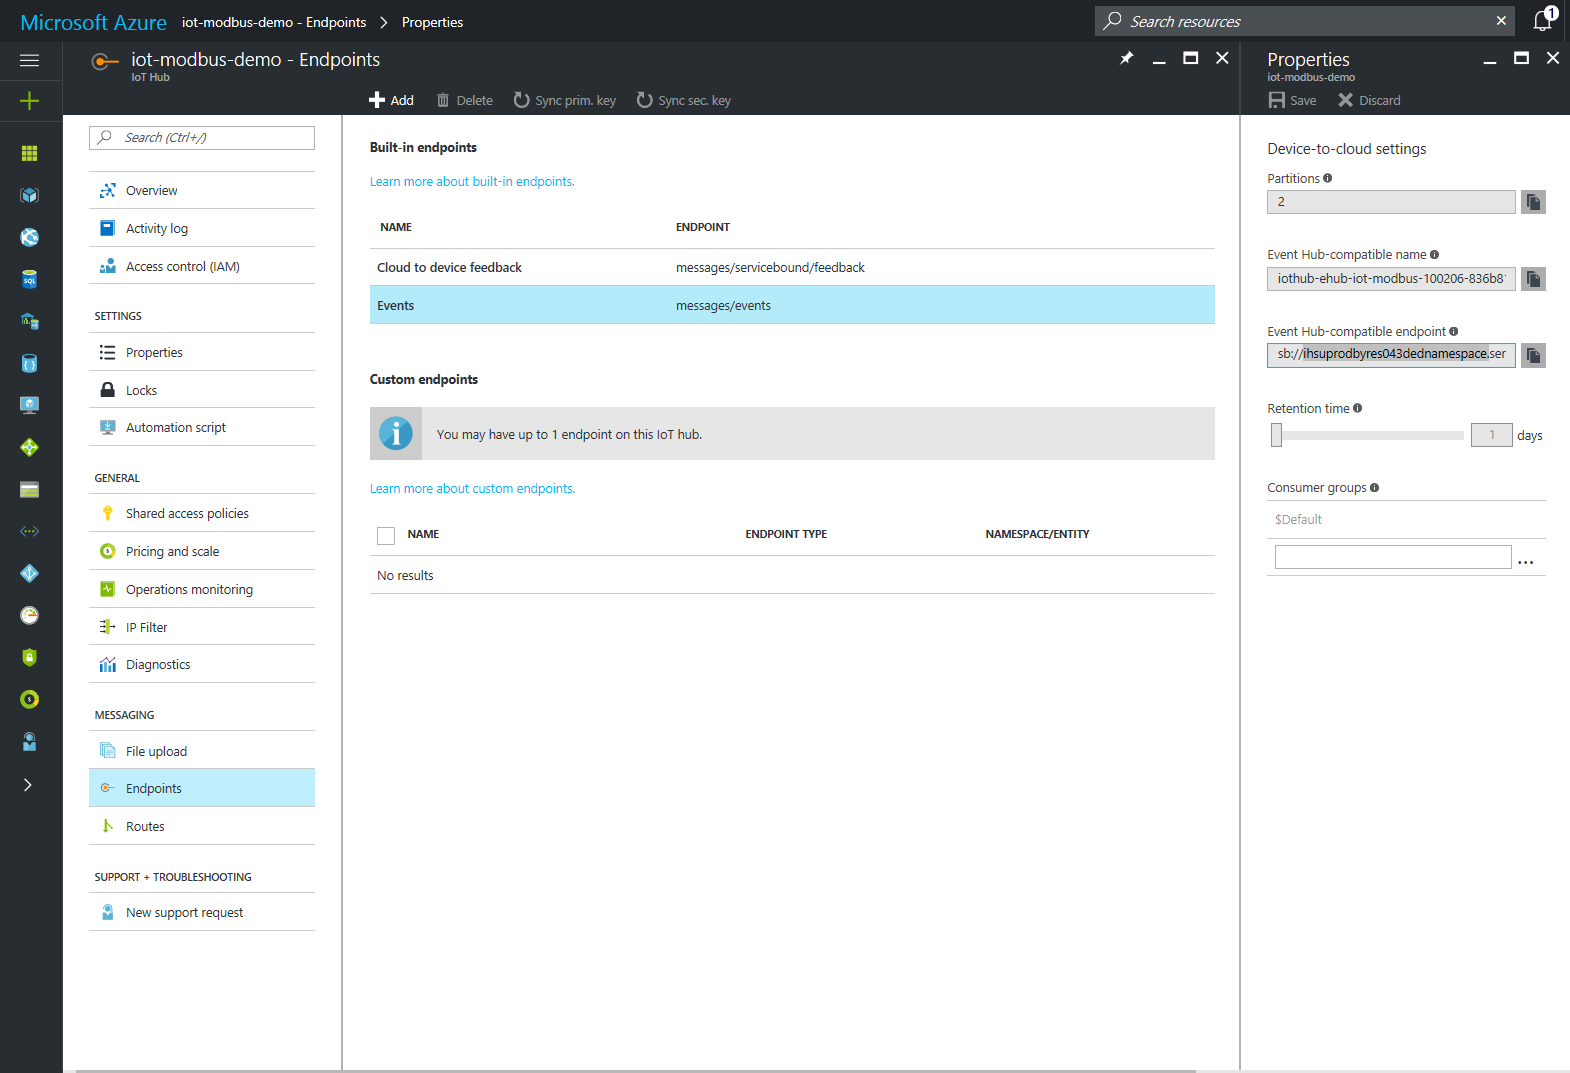
Back in the Hub’s primary blade, select the Endpoints tab under messaging.
In the new blade select the Events entry under Built-in endpoints. Once
the new blade opens, copy the Event Hub-compatible name value and the first
segment of the Event Hub-compatible endpoint value (e.g.
ihsuprodbyres043dednamespace) into your text file. We’ll use these values
in a moment to hook up our Azure Stream Analytics Job.
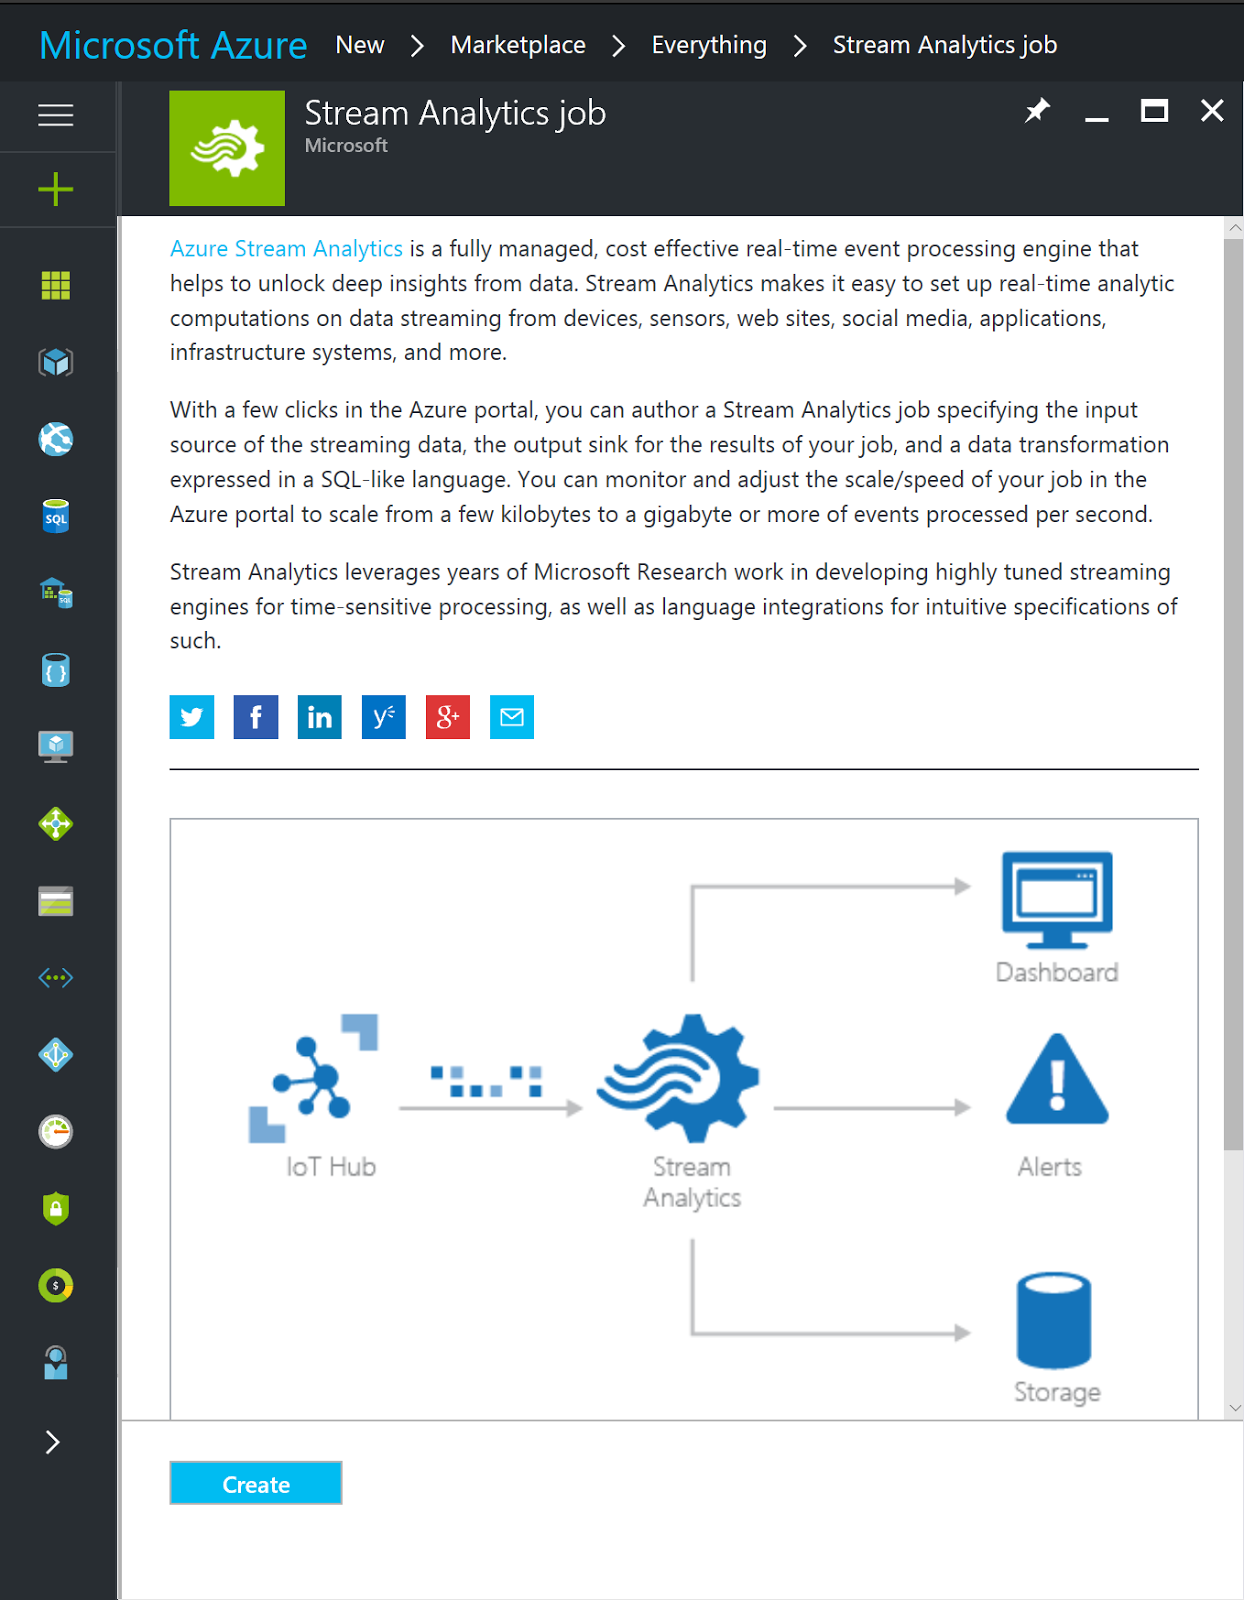
Next, we’ll need an Azure Stream Analytics(ASA) Job to perform some data
scaling on the path toward PowerBI. While this operation could be performed
in the gateway, ASA provides us an opportunity to sniff/validate our data and
opens the door to easy persistence, should we so choose. Again click the plus
(+) icon in the upper left corner and search for Stream Analytics. Once the
resource is located, select Create in the blade’s lower left corner.
 Configure the
ASA job with a unique name and place it in the same resource group as the IoT
Hub.
Configure the
ASA job with a unique name and place it in the same resource group as the IoT
Hub.

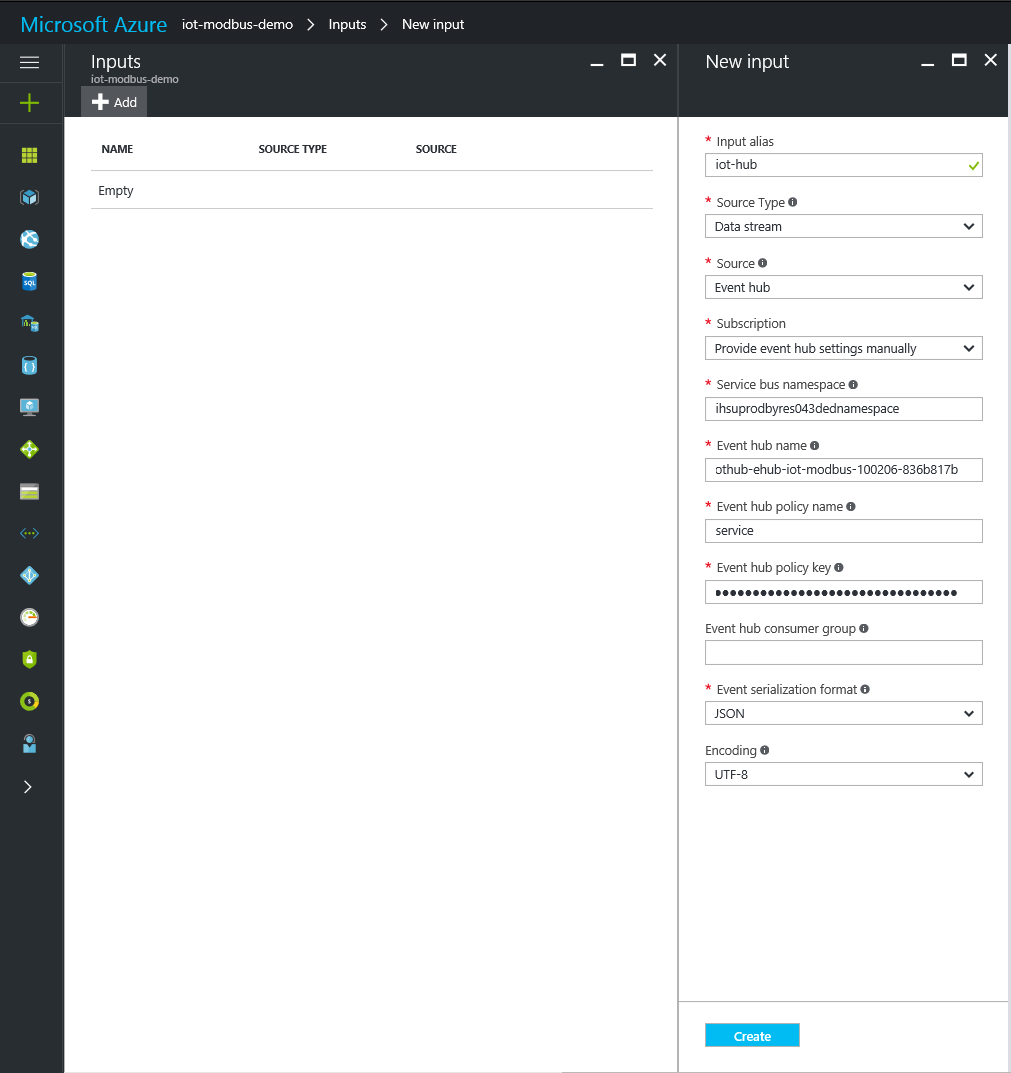
We now need to patch the IoT Hub as the input for the ASA Job. In the overview
pane, select the input section under Job Topology, and press add at the top
of the new blade. Enter an alias that will be used to reference the input in
the ASA query. Make sure that the Source Type is set to Data Stream and
the Source is marked as Event hub. Unfortunately, the Event Hub input
blade will not automatically recognize the IoT Hub’s Event Hub endpoints, so
we’ll need to set the Subscription field to Provide event hub settings
manually. Paste in the Service bus namespace, the ‘Event hub name’ and the
Event hub policy key from your text file. Finish up by setting the Event up
policy name to service and press Create. There is no need to define a
non-default consumer group and the data will be JSON formatted, encoded as
UTF-8
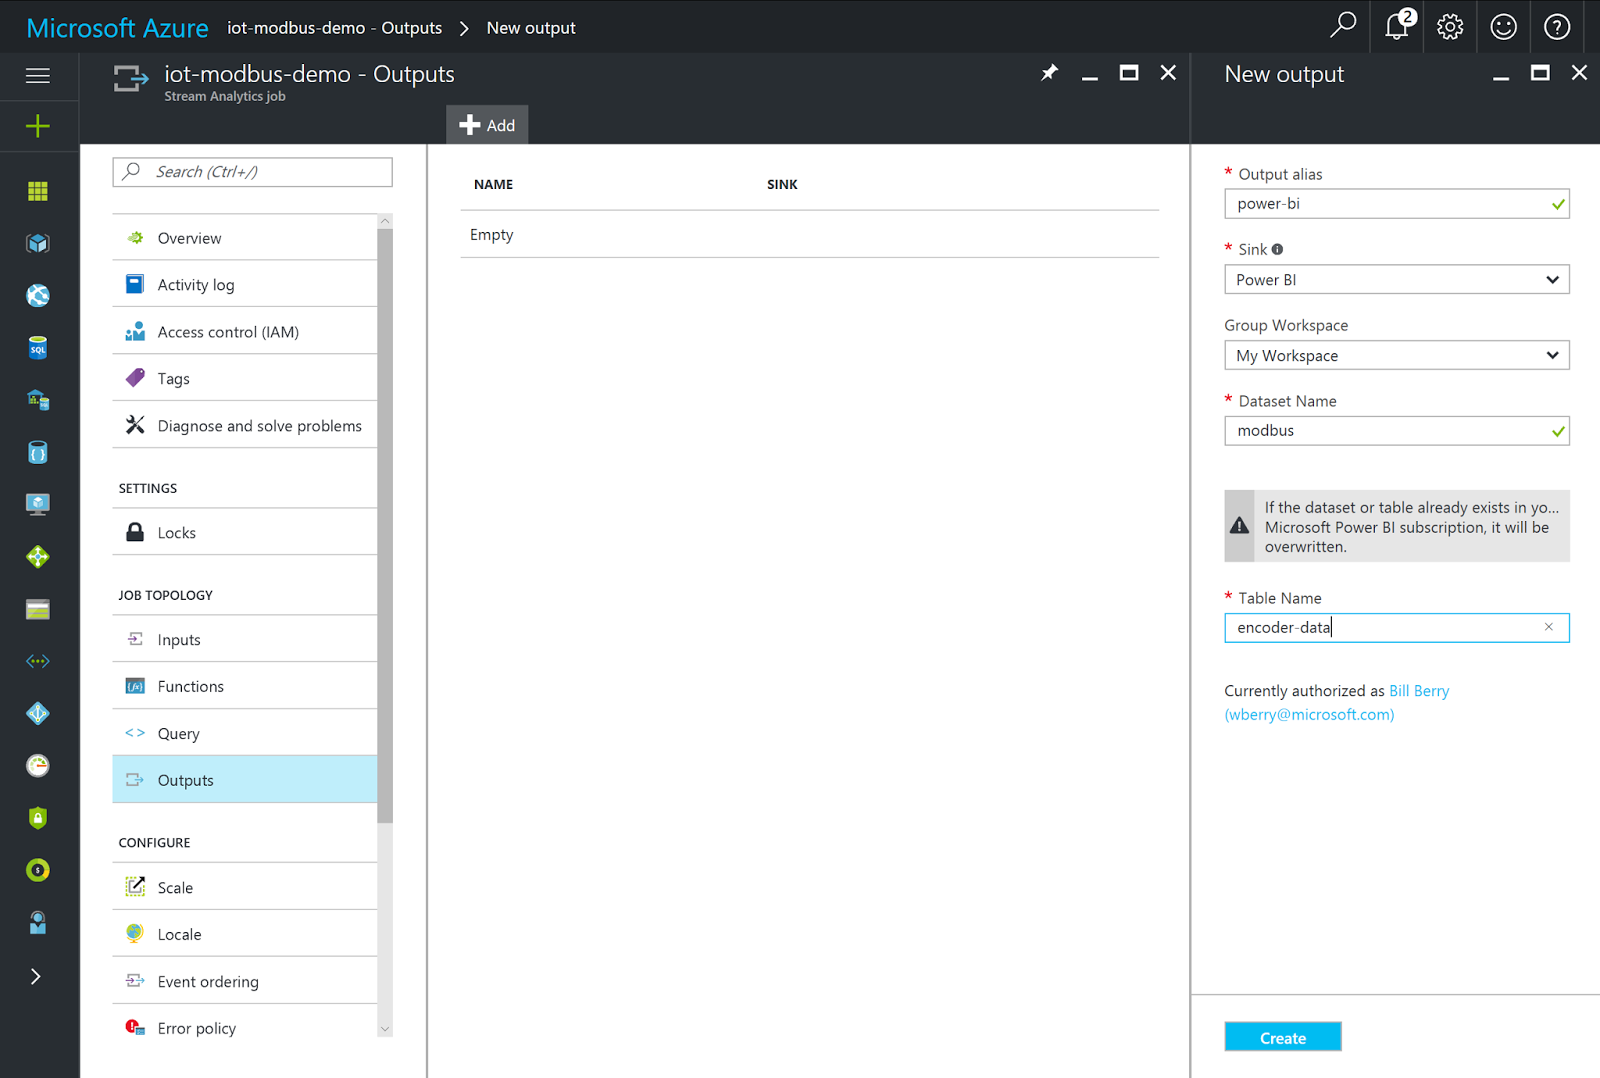
Before we define our ASA query we should set up the output hook to PowerBI.
Back under the ASA Job’s overview tab on the main blade, Select the Output
section under Job Topology and press Add at the top. Enter power-bi as
your Output alias, set the Sink to Power BI and press authorize. You’ll
be asked to enter your Power BI credentials at the login. If you don’t
already have a Power BI account, you can sign up for one
here. Once the prompt
completes login, enter in a Dataset Name and target Table Name.
The last bit of ASA configuration we need to handle is setting up the query.
For now, we’ll build the query based on values that might end up being
slightly different when you wire up your device.
Navigate the the Query section under Job Topology and select it. A new
blade will open up that will list the Input and Output alias previously
defined and a code editor to enter the ASA query. We’ll start by selecting
the observation time stamp and the device type value. As I noted earlier, we
need to do some maths to range our encoder value to get the data in shape for
PowerBI visualization. To range the encoder value, cast the string to a
float, devide by the ranges max count (in this case 65535) and multiply by 100
to push to percentage.
Once the query is entered, select Save at the top and back on the ASA home
blade, press Start to kick off the job.
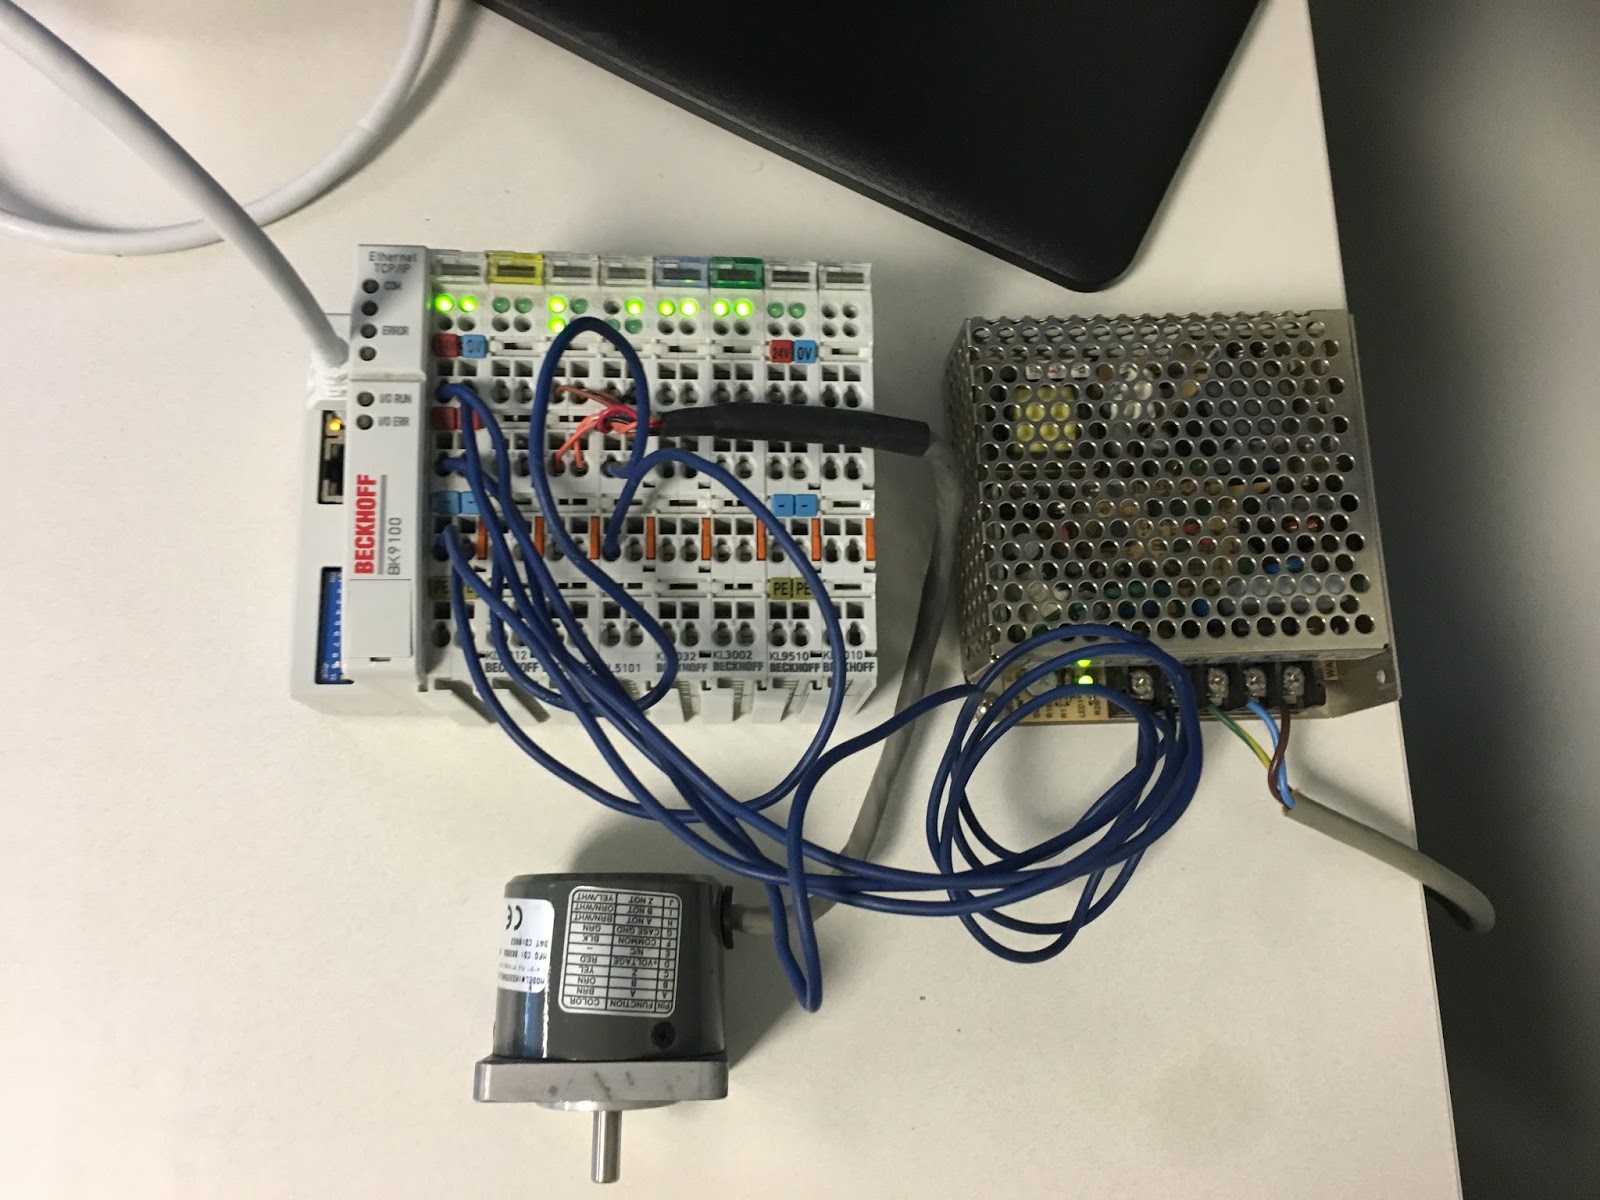
We can now turn our attention back to our Modbus device and complete the wiring of it to the gateway. As I noted earlier, I’m using a Beckhoff BK9100, Modbus capable, bus coupler along with a pretty standard Dynapar 2 channel optical incremental encoder (no Z full rev. channel). The Process Image for the coupler includes 8 channels of DIO in front of the mapping space for the encoder module, leaving our counter value located at the second word of the process image. For the astute, the coupler is also confiugred for IPAddres assignment using BootP via Beckhoff’s TCBootP application.
The next step in the process is to register our device with the IoT Hub. While
there are a number of ways to accomplish this, I suggest you check out our
iot-samples repository on GitHub. Begin by either cloning the repo, or just
download the code directly. Navigate to Device Management -> csharp and
open the solution file in Visual Studio (Note, you might also want to checkout
my Introduction to Azure IoT with Fsharp
post too!). With the solution open, set the Create Device Identity project
as the startup project. In the config folder, copy the config.default.yaml
file to config.yaml. Enter the Host Name for your IoT Hub, and the
iothubowner’s primary key connection string, which can be found under the
IoT Hub’s Shared Access policies tab. Finish up by modifying the
Nickname and DeviceId values in the config file, they can be any value you
want. After you run the project, your device will be registered and a device
key will be populated in the config file, we’ll need that value shortly.
Open the script from my previous blog post in an Administrative PowerShell ISE session. You’ll need to set at least the following values:
- rootProjectPath
- iotHubName
- deviceName - same as the “deviceId” you registered earlier
- deviceKey - the value from the config file in the Device Management Project
- deviceMac - the mac address of your modbus device
- modbusServerIp - the IP Address of your bus coupler/plc/IO device
- modbusPollingInterval - the number of milliseconds between device polls
- modbusDeviceType - this is the value that is plumbed to ASA
- modbus * - note in the sample script, I’m reading unit 0, with function code 4 (read input registers), reading starting at register 2 (1 based), and only reading 1 word of data … you can see more about Modbus function codes on page 22 of the protocol spec.
Once you fill out your data and run the script, navigate to {projectRootPath}
-> azure-iot-gateway-sdk -> build -> samples -> modbus ->
Debug. Open the modbus_win.json file in a text editor and double check that
the document looks well formed.
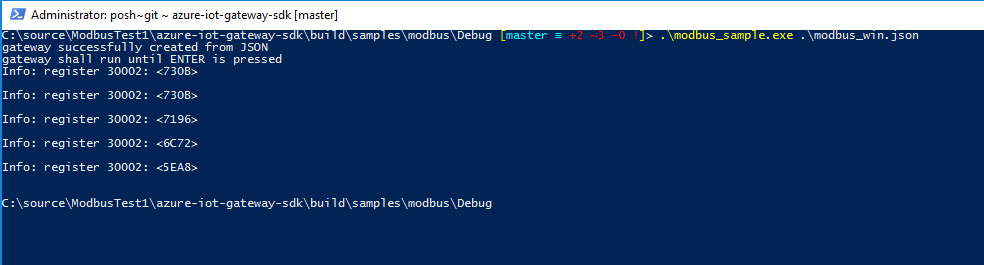
You can now open a PowerShell command prompt in the same folder and issue the following command to begin reading from the device and sending data to Azure > .\ modbus_sample.exe .\modbus_win.json You should see output similar to the following:
 Assuming you’ve set your polling to something reasonable, like 2000 (2
seconds), you should be able to run the application for a few hours on a day’s
allowance for the IoT Hub free scaling tier.
Assuming you’ve set your polling to something reasonable, like 2000 (2
seconds), you should be able to run the application for a few hours on a day’s
allowance for the IoT Hub free scaling tier.
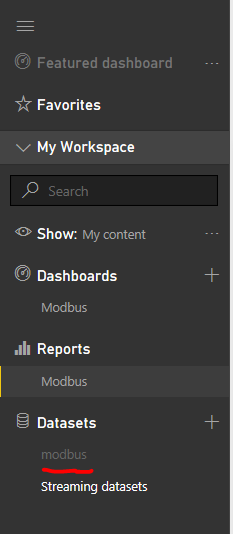
With data flowing to the IoT Hub and onto ASA, log in to Power BI. Though it
can take some time to finally show up, the ASA dataset should be visible in
Datasets group.
Select the Modbus dataset, and expand Visualization and Fields from the toggles on the right of the display.
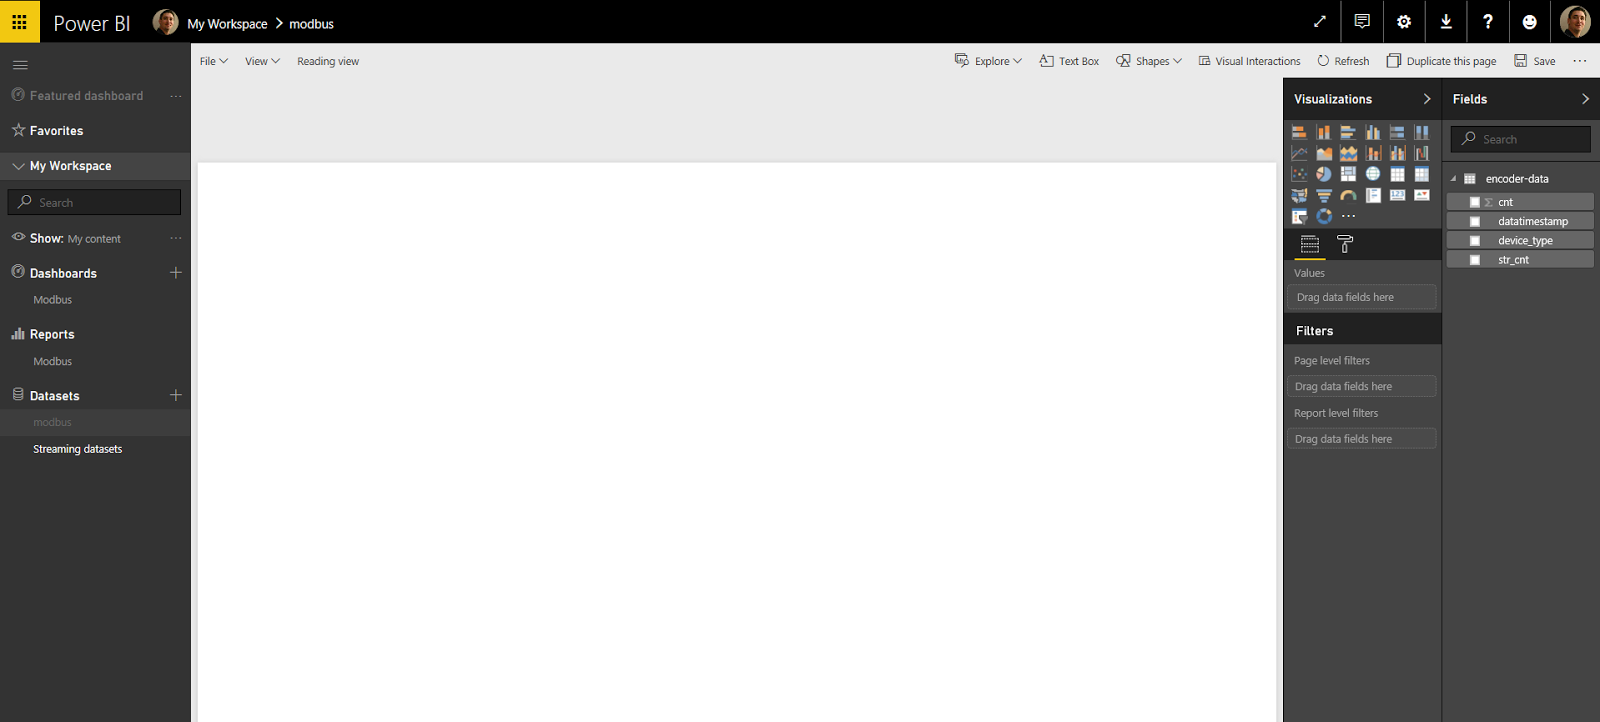 Add a
Add a Line Chart to the page and set the following values:
- Axis - datetimestamp
- Legend - device-type
- Values - cnt

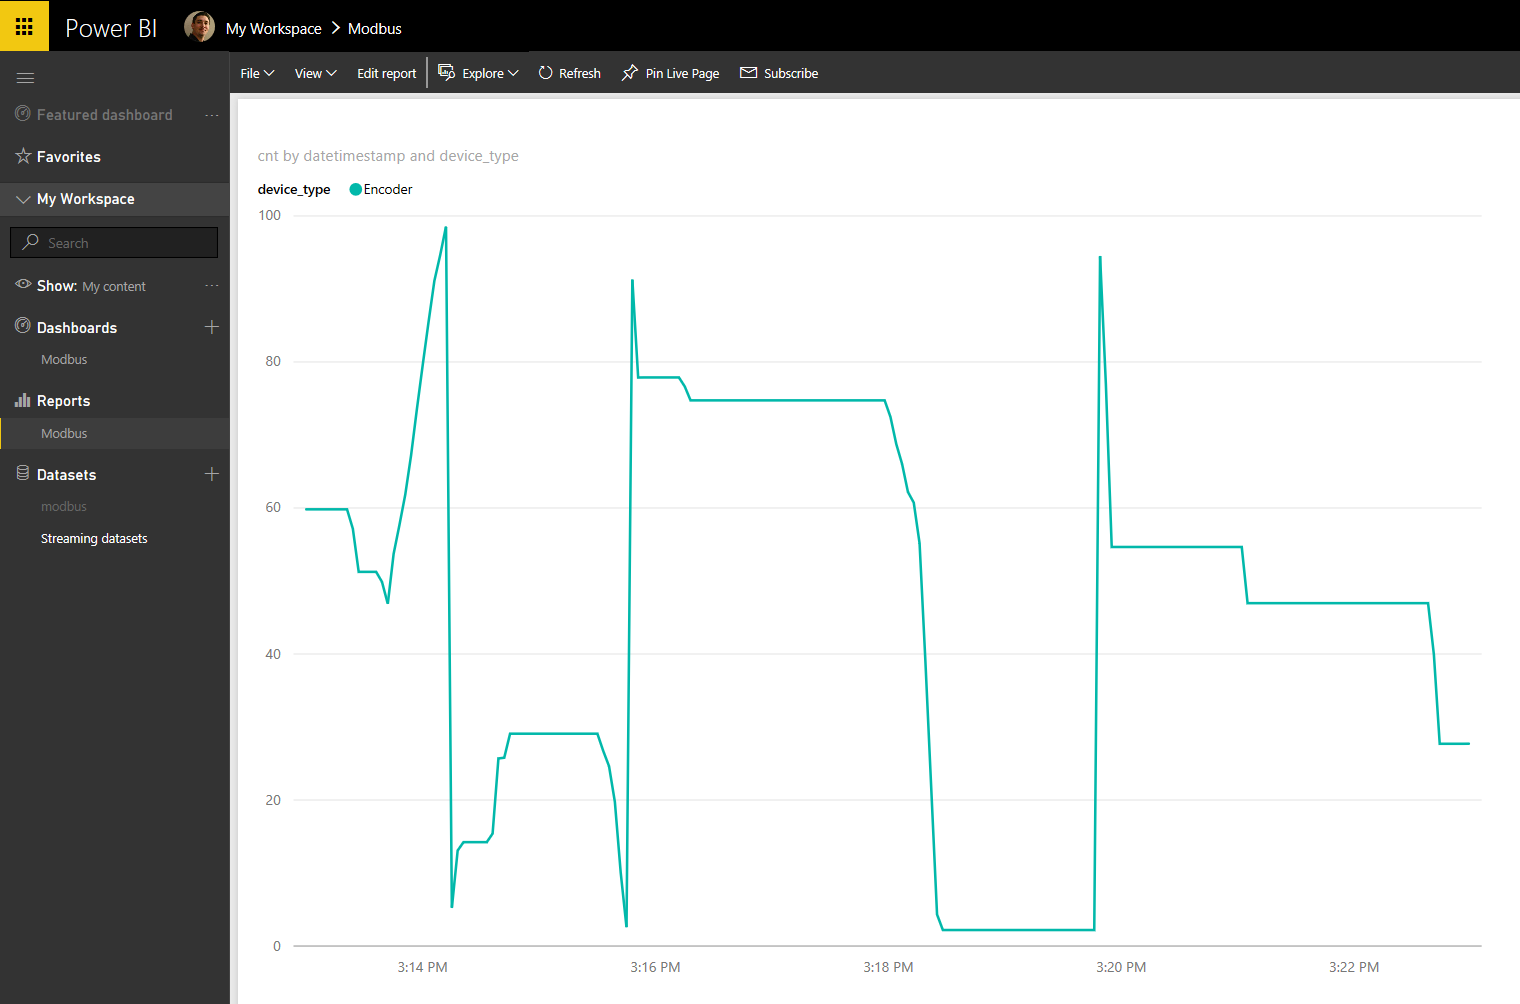
In the Filters menu for the chart, select the datetimestamp field and set
the filter type to Top N and show the last 20 items. This will produce a
realtime graph of data streaming from the device. The default polling
interval should be around 3-4 seconds. The resulting data will look like
this!
Happy Coding!